A brief analysis of signal conversion related topics
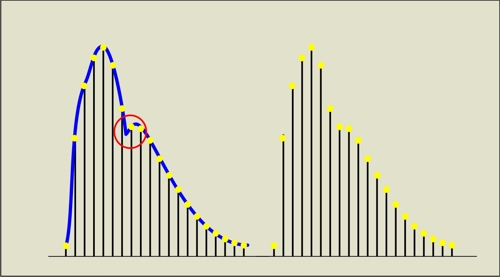
Signals in the real world are "analog" i.e. they have continuous variation in time and value as represented by the blue line in the
image below. To capture and analyze analog signals using digital systems like computers, it's necessary to convert such signals in digital
form. Basically with this conversion, a portion of the information contained in the original signal is lost but a well-designed conversion
system allows for the original signal "reconstruction " including all the relevant details.
Two main parameters must be considered: sampling frequency and
vertical resolution.
Sampling frequency
Sampling frequency
corresponds to the number of signal samples captured each second (for example 1KHz or 1000 samples/sec it means that each time period of
one second, 1000 samples are captured). In the upper image, sampling time intervals are represented by the vertical black lines: at each
interval, the corresponding values of the signal (yellow dots = samples) are recorded. In this example, the very low sampling frequency, related
to the frequency components of the signal (in other words the harmonic components according to the Fourier analysis), produces as result the
loss of the systo-diastolic notch in the red circle. On the right side of the image, the yellow dots represent the captured signal.
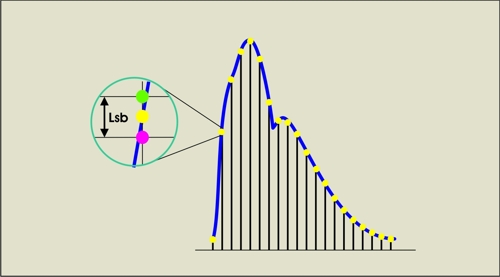
Vertical resolution
Vertical resolution:
theoretically at each sampling interval exactly the value of the original signal is captured. Actually, the number of values that the yellow
dots (samples) can assume in a digital system is not infinite but finite. For this reason the yellow dot in the circle of the
image above will be replaced by the nearest between the violet one and the green one. The minimum interval between possible vertical values corresponds to one LSB, i.e.
Least significant bit. The lower the value of the LSB, the better the approximation of the samples pattern to the original curve, the higher the number of discretization levels of the system. A system with 16 bits of Analog to Digital conversion has 2 exp 16 = 65536 possible
vertical available levels for signal quantization.
PulsePen sampling frequency and vertical resolution are respectively 1000 Samples/sec - 16 bit, associated with a low noise signal capture stage, allowing
for clean signal detection with clear details, not interpolated and not filtered like other much more
expensive devices. It meets and exceeds the Artery Society guidelines requirements for applanation tonometry devices: